Introduction
- General
- What is risk?
- 6 questions to define the project
- The key areas of concern
- What should risk analysis provide?
- 3 Ways to view risk management
- General comments on risk assessment
- Accountability
- General comments on planning
- What are the core process steps to assess a risk?
- Simple process outline
- What are the basic overall process steps?
- Stakeholders
- Success measures
- Why carry out Risk Assessment?
- Project Life Cycle
The Risk Management process
- General
- Define
- Identify the risks and responses
- Organise - prioritise risks and responses
- Ownership - risks, responsibilities and contractors
- Estimation
- Evaluation
- Planning
Risk issues
Modelling
Events
Networks and branching
Other
Risk management - The Cumulative Probability graph
© Copyright 2020 all rights reserved March Limited
The Cumulative Probability graph
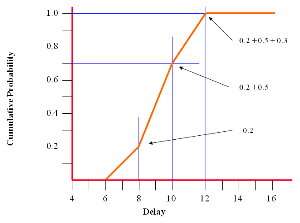
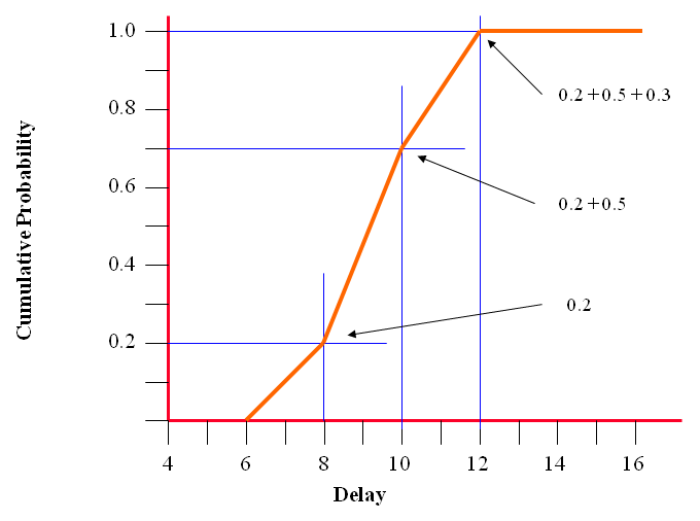
The Cumulative Probability graph of the simple estimating of risk [see Simple estimating of risk] is shown above.
Up to 6 weeks there is no likelihood that the delay will be lower raising to 0.2 (20 %) at the beginning of the 8 to 10 week range. The probability then rises to 0.7 (0.2 + 0.5) at the beginning of the 10 to 12 weeks, finally rising to 1.0 (100%) at 12 weeks.
Below 6 weeks is zero probability and above 12 weeks 100%.
other areas of interest in the series
- PRINCE2 2009PRINCE2 2009 updates PRINCE2 2005 and covers the principles, the themes -
business case, organisation, quality, plans, risk, change and progress.
The processes – starting up a project, directing a project, initiating a project, controlling a stage,
managing product delivery, managing a stage boundary, closing a project and tailoring PRINCE2 2009 and more... - PRINCE2 2005PRINCE2 2005 covers definition, terminology, the processes - Starting up a Project (SU), Initiating a Project (IP),
Directing a Project (DP), Controlling a Stage (CS), Managing Product Delivery (MP), Managing Stage Boundaries (SB),
Closing a Project (CP) and Planning (PL). The components – Business case, Management of risk,
Quality in a project environment, Configuration management Change control, Organisation, Plans and Controls.
Also, Product-based planning, change control technique and quality review technique and more... - Project managementProject management covers planning, milestones, objectives, scope, control, estimating, assumptions and constraints, problem statements, mission statements, identifying strategy, deliverables, work breakdown structure (wbs), plan types, dependencies, PERT, critical path management (cpm), cost terminology, the project manager, report writing, manual methods, resource levelling, popular project management systems, quality function deployment and more...
- Risk managementRisk management covers proactive and reactive planning, triggers, monitoring and control, risk combination,
what is risk, core process steps, project life cycle, terminology, cumulative probability graph, modifying plans,
plan types, identifying risk issues, assessing risk, cost model, Monte Carlo distribution, probability density function (PDF), uncertain events, correlated events, budget versus contingency, simple networks, Markov chain and more... - Time managementTime management covers goals, objectives, time logs, filing, delegation, planning, key time destroyers,
prioritising, urgent versus important, typical process, strategies, positive thinking,
mind maps, monochronic and polychronic time, culture,
convergent and divergent thinking, assertiveness, stress and more... - LeadershipLeadership covers definition, the vision, influencing, change, confidence, motivation,
strategy, personality indicators, trust and integrity, empowerment, prioritising, proactivity,
SWOT analysis, strategy, insight, personal direction, the three C’s, being positive, self discipline,
leadership training, meetings and agendas, styles and more... - MotivationMotivation covers performance management, empowerment, relations and needs, integrity and trust,
consequences, positive and negative reinforcement, measurement, feedback, goals, rewards,
appraisals, creativity and labelling, communication, coaching and mentoring, teamwork and self motivation,
insight, intuition, foresight, inspiration and influence and more...
© Copyright 2020 all rights reserved March Limited