Risk management - Risk of exceeding the target cost
Risk of exceeding the target cost
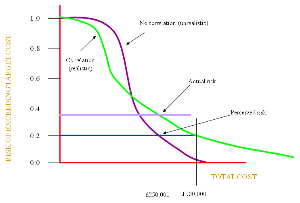
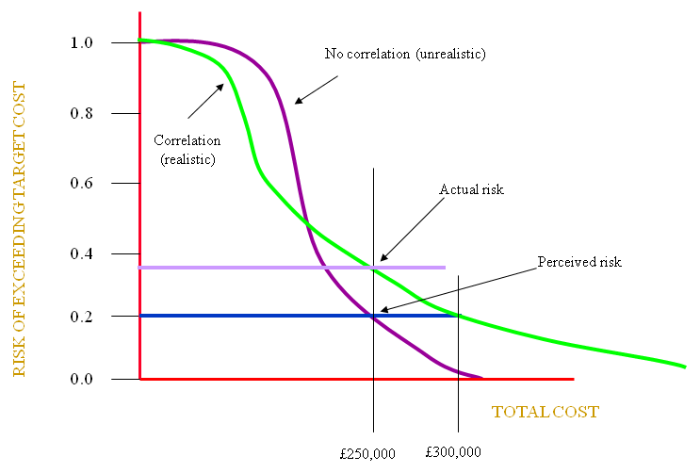
If we carry out the analysis without the use of correlation techniques we might expect to see a steeper curve (purple above) in the graph above. Correlation will tend to give rise to more extremes so the curve will be more shallow (green above). The green curve will therefore represent a more realistic scenario.
So, if we use a RISK of 20%, (see earlier [see Monte Carlo risk distribution], where we discussed not using a value of ‘total cost’ much lower with the risk being on the sensitive vertical part of the curve), we might reach a total cost for the project of say £250,000. Initially, we would say there was a 20% risk of this cost being exceeded.
However, in reality we should have been on the green curve where correlation has been taken into account. Here the RISK is nearer 35%, a much higher risk of exceeding the target ‘total cost’.
Really, the ‘total cost’ should have been set at a much higher value say £300,000 with a true risk of 20%.
In a group of correlated activities, once one has had its value randomly set, all of the others will fall into line with the same high, low or medium value.
In other words, if you do not allow for correlation your costs are likely to be low with an increased risk of exceeding them.