Counting and judgement
Raw data counting
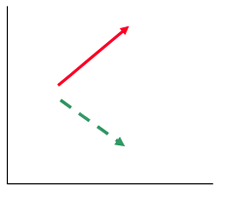
Ogden Lindsley identified 12 patterns of correct and incorrect performance.
Two of them called ‘jaws’ and ‘crossover jaws’ are seen in the diagram above.
The red line indicates counting of correct performance which is increasing (jaws and crossover jaws) and the green dotted line represents errors in performance which are decreasing (jaws and crossover jaws).
The other twelve are:
- Climb
- Take-Off
- Uphill
- Dive
- Aim
- Mid-Level
- Surface
- Downhill
- Landing
- Snow Plough
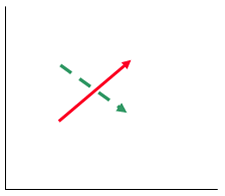
In these other diagrams the arrows are in combinations of up (at 45 degrees, increasing), horizontal (no change) or down (at 45 degrees, decreasing).
Jaws was named in the 1970s as the right half of it resembles the jaws of an open mouth, as with that of a shark.
Additionally, the blockbuster motion picture "Jaws" was current back then.
The ‘jaws’ becomes the ‘crossover jaws’ when the frequency of performance errors exceeds the frequency of corrects.
Both ‘jaws’ and ‘crossover jaws’ represent a desired learning picture, typically.
It shows improvement in both correct and error learning.
The corrects accelerate up toward some correct frequency aim.
The errors decelerate down toward an error frequency aim.
So, the learning picture exhibits both correct learning and error learning.
Judgement
Judgement as it name appears to suggest could be rather random.
It may vary depending on what you are trying to judge or who is doing the judging.
Many sports don’t have a unique winner that either crosses a line (400 metres hurdles) or gains the most points (decathlon).
They have to be judged.
This judgement is against predetermined criteria and marks are awarded accordingly.
Good examples are ice skating or high diving where judges are looking for particular attributes before awarding a mark.
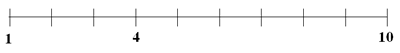
In this manner you can devise a scale on which to rate performance as in the above diagram.
This is called a Behaviourally Anchored Rating Scale (BARS).
The are several steps you need to carry out:
- Identify the task. Make sure you have pinpointed (described) this well.
- Generate a list of behaviours that are required to complete the task.
- Allocate the behaviours to the chart such that a rating of ‘1’ will be lowest performance and ’10’ the highest.
In simple terms if you had a total of 10 behaviours you are looking for to give the highest performance you can then put these in the order that you would be looking for to progress from low to high performance.
For example, ‘1’ may have one behaviour, ‘2’ may have that for ‘1’ and another.
‘4’ may have all those of ‘3’ and a new one. This simple increase can be tailored as you wish depending on what you believe constitutes progress from low to highest performance.
Then record a rating for the completion of the task based upon your observation.
This must be reliable (see behaviour - results orientated ) and should be verifiable by another.
The results for any measurements (counting or by judgement) should match the behaviours you have identified.
Remember that both results and behaviours should be well defined, that is, pinpointed.
If you observe all the correct behaviours but the result is still below the required performance then either:
- Your behaviours may not be correct and the pinpoints may need attention
- The behaviours are good but the pinpointing of the result may be at fault.
You may need to examine these and modify them accordingly.
Eventually, you will identify all the correct behaviours needed to achieve the correct result.
You want to improve an individual’s motivation for receiving measurement.
When carrying out measurements make sure you give positive reinforcement even if the results are not what you would like.
The aim is to reward people for accepting measurement which will ultimately lead to improved performance.