Control – part 9 - Cost - Cash flow
Cash flow
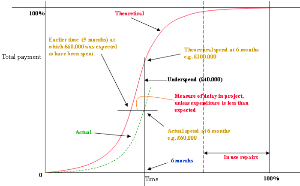
The diagram below is not strictly speaking cash flow, which indicates when money is actually paid.
It simply shows the total money spent (in theory, see below) on the project at a given point in the lifecycle.
There is usually a delay in the actual payment of cash to suppliers, contractors etc, so this is not strictly speaking cash flow.
It represents the total of actual spend and committed spend.
The red ‘S’ curve shows the theoretical spend if all goes according to plan, according to the work carried out.
Clearly, at time zero we expected to have spent zero.
At some point in the project, say 6 months, we expect to have spent £100,000 according to the theoretical red curve.
This red curve is also an approximate indication of the progress of the tasks within the project, that is, as we get towards the end of the project we expect to complete all expenditure.
At the 6 month period in the above example the expected spend was £100,000, whereas the actual spend was £60,000.
Hence, the underspend is £40,000.
On the assumption that the original plan did not woefully overestimate the likely spend this represents a delay in the plan from the theoretical curve.
The sum of £60,000 should have been spent one month earlier at 5 months.
The plan is therefore about 1 month behind schedule.
If the plan is on track, in terms of activities, this then represents a saving of £40,000 against the budget.
The reasons behind this should be examined as this may not be due to prudence and good cost control but more likely poor estimating techniques.
Note:
The dashed vertical line represents a point, say 4 to 6 months prior to completion of the total spend.
One of the final stages of a project is the handover after a commissioning exercise.
The product is then in use by the client or ultimate user, for example, a heating and ventilation system or a building.
It is a common practice to hold back some of the cost (e.g. 10%) to make sure that any faults found in the product (over the next 4 to 6 month period) are rectified.
This is usually the client withholding a sum of money from the appropriate contractor as an incentive to make good repairs.
Of course, funds may be required (almost certainly) before the actual project even starts.
Many projects will need a considerable amount of working capital.
Small contractors for example may require swift payment as their own working capital may be limited which may compromise their work on the project.
Likewise, government bodies are often tardy in paying which may compromise the Project Manager’s own working capital.
Working capital needs to be considered very carefully.
The use of contingency and tolerance within PRINCE2® is treated differently.
Under PRINCE2 2009 contingency is not used instead tolerances are set.
A PRINCE2 [see ‘The Complete Project Management plus PRINCE2’] principle is that projects are managed by exception, setting tolerances for project objectives to establish limits of delegated authority.
Tolerances define the amount of discretion that each management level can exercise without the need to refer up to the next level for approval.
[see Progress - purpose]
Tolerances are the permissible deviation above and below a plan’s target for time and cost without escalating the deviation to the next level of management.
There may also be tolerance levels for quality, scope, benefit and risk.
[see Progress - Progress defined - Exceptions and tolerances]
PRINCE2® is a Registered Trade Mark of the Office of Government Commerce in the United Kingdom and other countries.


