Manual methods – part 3a – task flow charts
General
At some point in time all projects are managed via a task flow chart either on paper or much more commonly on computer software. For the most part the use of computer software has increased the speed of putting together accuratetask flow charts and it is often easy to switch the view from one type to another.
However, it is important to get to grips with the underlying principles of what the computer software so easily indicates.
With a good understanding of original manual methods you can better use electronic means.
The ease with which computer software can update a schedule when changes are made makes it a very useful tool for looking at different scenarios and their effects on the overall project.
Task and event
A task is the activity of carrying out something in order to begin and finally reach a goal.
This is what we want to get to – task completion.
The start and end of a task are ‘events’ that signify these points.
An event does not use any time and hence no resource, it is just a marker of the start or completion of one or more actions.
For two tasks that follow on after each other an ‘event’ can occupy the same position. This is because the ‘end’ event of one task is the ‘start’ event of another. We don’t indicate two as one will do the job for both the start and the end.
A network is any graphical representation of points that are joined by lines.
Bar charts (Gantt chart)
The most common form of schedule used is the bar chart which lends itself to an easy visual summary of the project.
It consists of a series of horizontal bars.
The front and end of the bar represent the start and finish of the task respectively. The length of the bar shows the task duration.
Dependency arrows may be seen joining particular bars to indicate the order of task completion.
A simple bar chart of nine tasks was shown earlier.
The equivalent AON and AOA network is discussed below.
Activity-on-Node networks
The Activity-on-Node network and the Activity-on-Arrow networks derive from the ‘precedence grid’.
Initial networks derived from the grid will be messy and require many corrections. It’s a good idea to use a pencil and rubber.
Whether you are drawing an Activity-on-Node network or an Activity-on-Arrow network both begin with the milestone ‘start’ and end with the milestone ‘end’.
These are also known as AON networks or ‘bubble’ diagrams.
The three diagram systems use slightly different methods to represent tasks and events.
They satisfy different purposes and are thus interpreted in different ways.
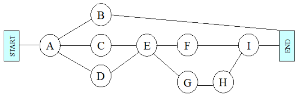
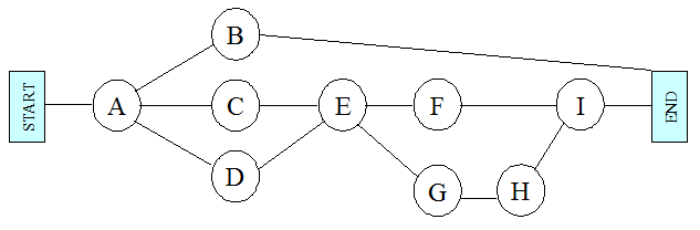
In the case of the AON network the ‘tasks’ are represented by the ‘bubbles’ as in the above diagram , that is, ‘A’, ‘B’ and ‘C’ etc.
The lines joining each ‘bubble’ show the ‘precedence’ of the tasks, that is, the order in which the tasks will be carried out.
Note that this is not quite the same as ‘dependencies’ which show which tasks cannot begin until another has completed.
For example, in the above diagram task ‘B’ follows task ‘A’ but no other tasks follow it except for the ‘end’.
This means that task ‘B’ can be completed any time after task ‘A’ provided it doesn’t delay the end.
However, task ‘E’ will be later than task ‘B’, if it is carried out as soon as possible, but is not dependent on it.
The diagram merely represents a timeline of task activity order.
Those to the right will start or complete after those to the left.
The fact that the lines meet at ‘nodes’ gives the system its name of Activity-on-Node.
Notice that in this method there are very few ‘milestones’ which are events. In this case we just have the ‘start’ and ‘end’ milestones.
When there are many more tasks in the work breakdown structure list the precedence grid will be larger and it is possible that many anomalies will be spotted and eliminated eventually leading to the final version. Even at this stage constructing theActivity-on-Node networks can be messy and will require tidying up to a visually neat version.
Even at this stage you may find redundant links that can be removed.
In summary, the Activity-on-node method indicates the logical flow of the tasks. The flow is based on simple ‘finish to start’ links.
That is, one task cannot start until another is finished. It can be more sophisticated using other types of logical dependency, such as, ‘finish to finish’, ‘start to start’ and ‘start to finish’. It can also allow ‘lags’ and ‘leads’. These are easier to manage in a computerised system.
The bubbles represent the tasks and as such could actually be a sub-project in their own right.
For example, task ‘G’ could consist of several tasks itself or indeed may have more than one sub-project.
The Activity-on-Node network will look simpler at higher levels of the work breakdown structure.
The example in the diagram is relatively simple. However, had task ‘C’ been more complex we may have identified a series of tasks, say, ‘c1’, ‘c2’, ‘c3’, ‘c4’, ‘c5’. Had this been the case they would have stood out both in the precedence grid and the Activity-on-Node network as a set that depended upon each other and could be ‘rolled up’ into a higher level task.