The Gantt chart
The Gantt chart
The Gantt chart is ubiquitous in relation to project management.
It was developed by Henry Laurence Gantt (1861 to 1919) in the early part of the 20th century.
He was a mechanical engineer and management consultant. They have been employed in hundreds of major construction and other projects since.
Whilst being famous for the bar chart he also developed a ‘task and bonus’ system for the payment of wages as well as examining worker efficiency and productivity. Born in Calvert County in Maryland in the USA he initially trained as a teacher and draughtsman.
Whilst Henry Gantt developed the bar chart he also introduced other types of chart. His aim was for foreman and supervisors to be able to easily see their task progress and to make a judgement as to whether they were still on schedule or behind.
In 1903 Gantt described his method. He identifies two types of ‘balances’.
The ‘man’s record’This shows what each worker should do and did do.
The ‘daily balance of work’This shows the amount of work to be done and the amount that is done.
The latter had rows for each day and columns for each part or each operation. These were headed by the amount needed.
The start and end of the activity was given by heavy horizontal lines in the rows.
It was promoted as ‘a method of scheduling and recording work’.
He also used cards to assign work to each worker and to record the work done each day.
Later (1916) he spoke about the use of schedules. He proposed giving the person an ‘order of work’ that listed the jobs that had to be carried out that day. He also spoke about the need to avoid ‘interferences’. He noted that any schedule was useless if it was ignored.
In 1919 he describes two principles for his charts.
The first is they can measure the activities by the amount of time needed to complete them.
The second is that the space on the chart can be used to represent the amount of the activity that should have been done in that time.
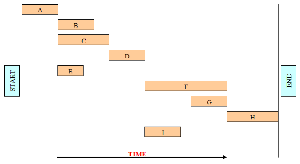
The bar charts shown during this period tend to be at a much higher level than we would typically see today.
Typical bar chart today
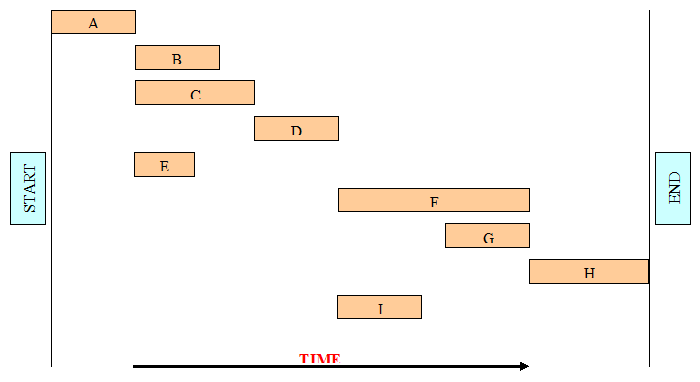
Task bars are shown in rows. The thickness of the bar has no relevance other than squeezing more in using suitable software. The length of the bar shows the time the task is expected to take, that is, the base value.
The actual time taken will depend upon the availability of resource, the number of workers applied to the task and other interruptions.
The task bar represents the entire activity. The left hand end of the bar shows the start and the right end the finish.
That is, these are the ‘start’ and ‘end’ events as would be seen on an Activity-on-Arrow network.
The arrow between these events thus indicates the actual task activity.
Under PRINCE2® 2009 [see ‘The Complete Project Management plus PRINCE2’] planning is covered by the Plans theme.
The purpose of the Plans theme is to facilitate communication and control by defining the means of delivering the products (the where and how, by whom, and estimating the when and how much).
Effective project management relies on effective planning as without a plan there is no control.
Planning provides all personnel involved in the project with information on:
- What is required
- How it will be achieved and by whom, using what specialist equipment and resources
- When events will happen
Whether the targets (for time, cost, quality, scope, risk and benefits) are achievable.
[see Plans - Purpose]
Identifying the plan activities and dependencies for a schedule are also covered within this theme.
[see Plans - The PRINCE2 approach - Identify activities and dependencies]
A plan can only show the ultimate feasibility of achieving its objectives when the activities are put together in a schedule that defines when each activity will be carried out.
[See Plans - The PRINCE2 approach - Prepare the schedule]
Plans are monitored by following the Progress theme.
The purpose of the Progress theme is to establish mechanisms to monitor and compare actual achievements against those planned; provide a forecast for the project objectives and the project’s continued viability; and control any unacceptable deviations.
[see Progress - purpose]
PRINCE2® is a Registered Trade Mark of the Office of Government Commerce in the United Kingdom and other countries.