Time management - Prioritising objectives part 2
Prioritising objectives part 2
Multiplication ranking
Priority ranking
(using multiplication)
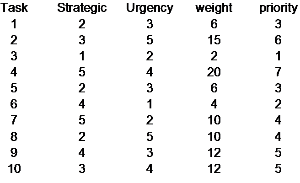
If instead of adding the ‘strategic’ and ‘urgency’ data we multiply it we get the results as above.
Overall the ranking is wider spread than for the addition method seen previously.
If we look at tasks 7 to 10 we get rankings of 4,4, and 5,5
For the addition method we got a ranking of 3 for each.
Yes, we still have some the same that require further analysis but it is slightly better.
We can see that if either the ‘strategic’ or ‘urgency’ weighting has a lower value, it ranks higher in the ‘to do’ list.
This seems sensible (tasks 7 and 8 have one weighting of 2, whereas the lowest in tasks 9 and 10 is 3).
However, we have to be a little careful as they also have lower ‘strategic’ weighting of 5 compared to tasks 9 and 10 which only have weightings of 4.
You will need to decide which method you feel more comfortable with.
We can look at using a tabular matrix. See next.


