Time management - Prioritising objectives part 3
Prioritising objectives part 3
Tabular matrix
Let us have a look at the multiplication example seen previously.
| Task | Strategic | Urgency | Weight | Priority |
|---|---|---|---|---|
| 1 | 2 | 3 | 6 | 3 |
| 2 | 3 | 5 | 15 | 6 |
| 3 | 1 | 2 | 2 | 1 |
| 4 | 5 | 4 | 20 | 7 |
| 5 | 2 | 3 | 6 | 3 |
| 6 | 4 | 1 | 4 | 2 |
| 7 | 5 | 2 | 10 | 4 |
| 8 | 2 | 5 | 10 | 4 |
| 9 | 4 | 3 | 12 | 5 |
| 10 | 3 | 4 | 12 | 5 |
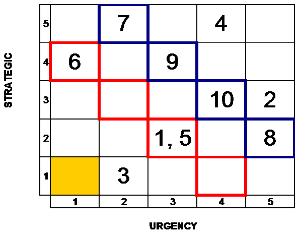
We can add these values to a tabular matrix as shown.
For task 1 we have ‘strategic’ = 2 and ‘urgency’ = 3 and we can put task 1 into the cross section of each of these values.
In this system we need to give higher priority to tasks situated nearest to the bottom left hand corner, that is, at the cross section 1, 1 (the yellow square).
We then need to tackle tasks in ‘diagonal’ manner towards the top right hand corner.
For each given diagonal we would give higher priority to those on the outside of the diagonal and work inwards.
So, in the case of the ‘red’ diagonal task 6 would have a higher priority over tasks 1 and 5.
For the ‘blue’ squares tasks 7 and 8 have equal priority and are higher than 9 and 10 etc.
Then comes task 2 and finally task 4.
This method, whilst being a little awkward to assess gives a good visual idea of the order of priorities.
The third method is discussed next.


