Risk management - Cumulative probability graph
Cumulative probability graph
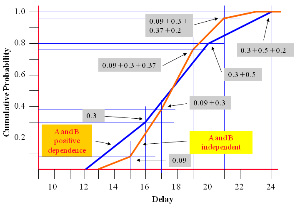
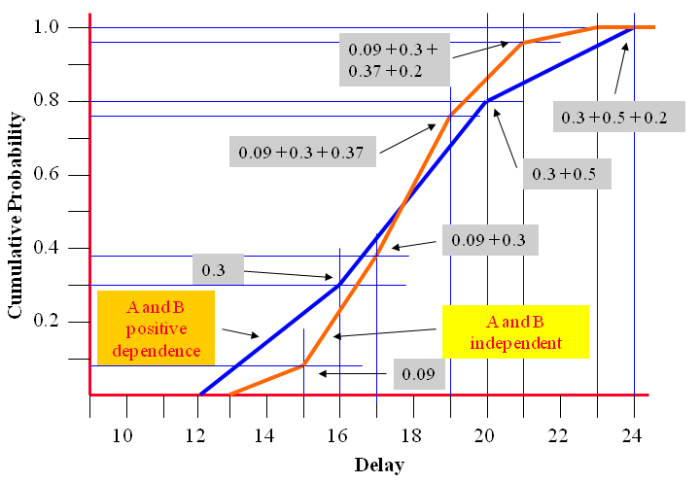
This shows the cumulative probability graph for ‘A’ and ‘B’ independent and compares the combined ‘A’ and ‘B’ with positive correlation [see Risk Management process - Evaluate - positive correlation].
Probability for ‘A’ or ‘B’
| Delay | Probability |
|---|---|
| 7 | 0.3 |
| 9 | 0.5 |
| 11 | 0.2 |
Probability for ‘A’ and ‘B’ positive dependence (100% correlation).
| Delay | Probability |
|---|---|
| 14 | 0.3 |
| 18 | 0.5 |
| 22 | 0.2 |
Probability for ‘A’ and ‘B’ independent (0% correlation).
| Delay | Calculation | Probability | ||||
|---|---|---|---|---|---|---|
| 14 | 0.3 x 0.3 | 0.09 | ||||
| 16 | 0.3 x 0.5 | + | 0.5 x 0.3 | 0.30 | ||
| 18 | 0.3 x 0.2 | + | 0.5 x 0.5 | + | 0.2 x 0.3 | 0.37 |
| 20 | 0.5 x 0.2 | + | 0.2 x 0.5 | 0.20 | ||
| 22 | 0.2 x 0.2 | 0.04 | ||||
Based upon the two above extremes.
What is the probability of the delay exceeding 21 weeks?
Well, for independent (0% correlation) the graph show that there is approximately 4% risk of exceeding 21 weeks delay (1.0 – 0.96).
In the case of the full positive dependence (100% correlation) there is approximately 15% risk of exceeding 21 weeks delay (1.0 – 0.85).
The actual value may be somewhere in between.
The analyst must allow a suitable correlation that is not at one extreme or the other.