Risk management - Simple network
Simple network
When you generate a schedule the software will contain specific values for durations and link particular activities.
The longest linked pathway will be called the ‘critical path’ and will determine the completion date of the project.
The type of software that generates these ‘Gantt’ charts can not cope with 3 point estimates.
We know that we can not be absolutely certain of each of the duration values.
If the total project duration is 6 months we may have more confidence than if it were 10 years.
The aim of the schedule estimating process is to generate a probability distribution of values for the project duration.
This information can then be utilised to support bids, project justifications etc.
Simple network
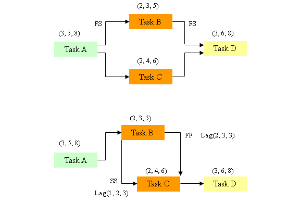
The above diagram shows 2 simple activity networks.
In the first one the pathway from Task A to Task D goes through Tasks B and C which both start at the same time.
In the second example there is a small lag prior to the start of Task C.
Note: The lags will also have a 3 point estimate.
Notice that both the pathways Task B and Task C will occur (their probabilities are 100%). They both require completion before Task D can complete.
So, these are not alternative pathways which might have a probability of occurrence less than 100%. We will look at these later [see simple branching].
Schedule risk assessment is not carried out in software that specialises in developing a network of task with dependency links.
Instead, it is carried out in a spreadsheet, for example, Excel.
In a similar fashion to cost risk assessment we will need to collect data for:
- 3 point estimates for each of the task durations
- The same for any contingencies (uncertain events)
- We will need the probabilities for each contingency pathway.
In addition, for a schedule we will need to agree the dependencies between each of the tasks.
As the task relationships, together with the 3 point estimates, cannot be described within suitable software it is easier to begin the exercise by putting the network of tasks down on paper.
You will need to be careful to generate the schedule at the right level.
If you use too much detail it will be much easier to be sure of task dependencies but may over complicate the data handling, unnecessarily, for the risk assessment.
It is best to carry out the schedule risk assessment at a fairly high level and limit the number of tasks in a model to fit a single page easily.
If other tasks are needed to complete the schedule then it is probably better to create a hierarchy of models.
There is no doubt that the finished schedule used for running the project will be different to that used for the schedule risk assessment.
This is what you would expect as the risk assessment has to be carried out before a base plan is formalised (usually at the planning stage).
When you have decided on the level at which to compile the risk assessment schedule think about what you can leave out of the equation.
Whilst some aspects of project management [see ‘The Complete Project Management package’] and [see 'The Complete Project Management plus PRINCE2'] have a cost to them they will often have little or no effect on the overall completion date.
For example, the continuing of the project management administration activity.
Often the ‘cost risk assessment’ is carried out ahead of the ‘schedule risk assessment’.
This can often be used as a good starting point for the schedule risk assessment as it will have generated a schedule to work with.
Often there is a close relationship between the ‘cost’ and the ‘schedule’ assessment. If the largest part of a ‘work package’ cost is labour then there may be a good correlation with the task durations.
For example, if a task requires an increase in the labour cost of 25% to complete it then it is likely that the duration will also increase by 25%.
However, you have to be careful with this simplistic relationship. It is quite often the case that you can add resource to a ‘work package’ that is struggling to complete it, in order to bring it back on track.
Hence, the labour cost will increase but the duration will stay the same.


