Risk management - Cumulative probability graph
Cumulative probability graph
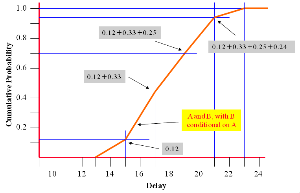
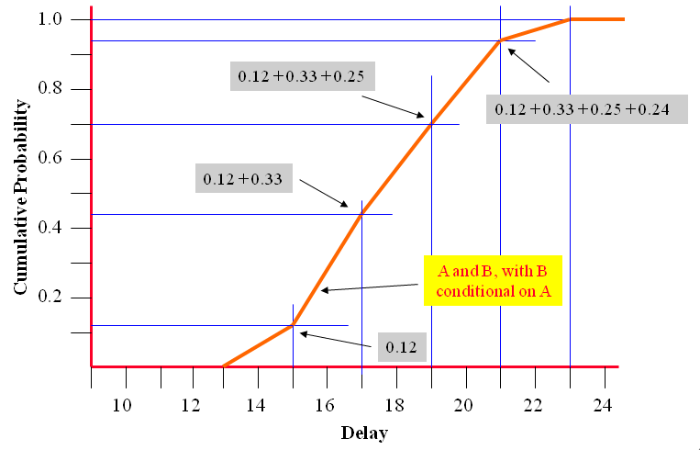
The above diagram shows the cumulative probability graph for a conditional relationship of ‘B’ to ‘A’ [see Risk Management process - Evaluate - conditional correlation].
| Delay | Calculation | Probability | ||||
|---|---|---|---|---|---|---|
| 14 | 0.3 x 0.3 | 0.09 | ||||
| 16 | 0.3 x 0.5 | + | 0.5 x 0.3 | 0.30 | ||
| 18 | 0.3 x 0.2 | + | 0.5 x 0.5 | + | 0.2 x 0.3 | 0.37 |
| 20 | 0.5 x 0.2 | + | 0.2 x 0.5 | 0.20 | ||
| 22 | 0.2 x 0.2 | 0.04 | ||||
In reality high levels of dependence between activities are possible and more common than realised.
This type of exercise questions the relationship of task ‘B’ to ‘A’ which may lead to a better understanding of the risks involved.
It is not an easy matter to extrapolate between conditional, independent and full positive correlation.
The interpretation of such combinations of probabilities requires the services of skilled analysts.
In this way a series of ‘S’ curves can be generated where each one represents the total of risk to date (i.e. the previous total plus the latest risk).
Perhaps 5 or 6 major risk areas would be the maximum to present in this format at one time so focus on the key risk areas at a high level.
If there are several low risks that are not significant in their own right combine these first and present this as one of the ‘S’ curves in the presentation.
The ‘gap’ between the ‘S’ curves on the ‘x’ axis (delay, cost etc) will give some indication of relative importance. The larger the gap the more significant the ‘S’ curve to the right. The information can be presented against data in the base plan (or reference plan), for example, the project end date thus demonstrating the affect of delays. Key conditions and assumptions should be mentioned.
From this simplified view of the overall risk to the project you may derive knowledge on the project end date which is unacceptable.
If the analysis shows that there is only a 10% chance of meeting the completion date you will need to review the plan.
This will involve dependencies, proactive aspects in the plan to mitigate risks and attention to any contingency plans.
On the other hand, the analysis may indicate a 35% likelihood of meeting the project end date. Whilst this may constitute an unsatisfactory situation the board may decide to accept the risk.
Elsewhere summaries some of the considerations when modifying a plan [see Ways to modify plans].