Risk management - Risk of exceeding target duration
Risk of exceeding target duration
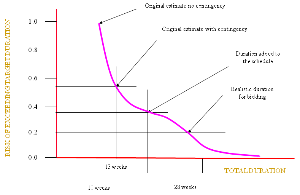
The above graph may well represent the output of the model shown previously [see production example part 2]. This is not an exact representation but demonstrates the type of data considered and conclusions you may draw.
The original estimate of the duration of the tasks was 10 weeks (the absolute minimum duration, without using 3 point estimates) and 13 weeks including a contingency. We can see that this would have had a very high risk of being exceeded, approximately 100% and about 55% with the contingency of 3 weeks.
In fact the more realistic duration to set (assuming a 20% risk of exceeding it) would be about 28 weeks, much higher.
The project manager in this case may well adopt a stance with a higher risk and could set the duration to, say, 20 weeks with a risk of exceeding it at about 36%. So, in terms of determining when the project will complete for bid purposes (if you are a contractor) we would use the 28 weeks (unless you wish to accept higher risk). However, for the purposes of the internal project schedule we might set a duration of 20 weeks and retain 8 weeks for contingency.
In general, the actual total cost is extremely unlikely to be the best and worst case scenarios. These would be MINIMUM = 10 weeks (100% chance of exceeding) and MAXIMUM = 54 weeks.
Had we assessed the total duration using only the MOST LIKELY values we would get a value = 31 weeks.
Whenever, correlation between tasks exists then the degree of uncertainty will increase.
The big difference between a COST and a SCHEDULE RISK ASSESSMENT is that for schedules we have DEPENDENCIES between the tasks in terms of their links.
In certain situations this can have a dramatic effect upon the risk assessment in terms of the uncertainty. There are 2 key areas to consider in the schedule these are NODES and BRANCHING POINTS.
These are discussed next [see nodes and branching networks].


