Introduction
- General
- What is risk?
- 6 questions to define the project
- The key areas of concern
- What should risk analysis provide?
- 3 Ways to view risk management
- General comments on risk assessment
- Accountability
- General comments on planning
- What are the core process steps to assess a risk?
- Simple process outline
- What are the basic overall process steps?
- Stakeholders
- Success measures
- Why carry out Risk Assessment?
- Project Life Cycle
The Risk Management process
- General
- Define
- Identify the risks and responses
- Organise - prioritise risks and responses
- Ownership - risks, responsibilities and contractors
- Estimation
- Evaluation
- Planning
Risk issues
Modelling
Events
Networks and branching
Other
Risk management - Probability density function - simplified
Probability density function - Simplified version
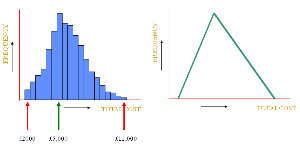
Let us say that we have activity ‘A’ with the following characteristics.
| MINIMUM | = £2000 |
| MAXIMUM | = £11,000 |
| LIKELY | = £5000 |
We could derive a PDF curve (the actual curve will follow the outline of the columns which we have used to represent specific ranges) as in the diagram. The end values are the MINIMUM and the MAXIMUM values and the LIKELY value is at the peak.
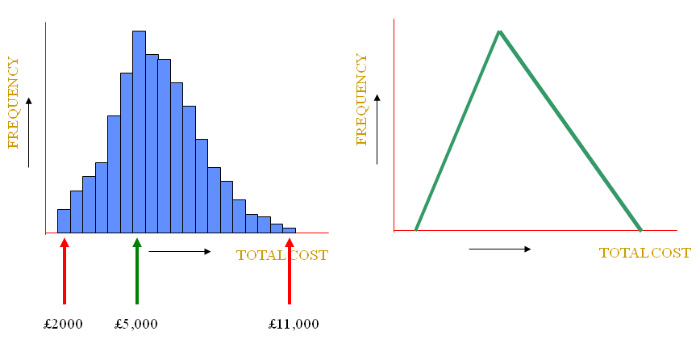
This is nicely (and more simply) represented by the 3 point model for each activity (MINIMUM, MAXIMUM and LIKELY values). However, the shape of the curve can be simplified to straight lines between these 3 points without compromising the data.
This TRIANGULAR PDF will simplify any calculations. See the diagram above.
other areas of interest in the series
- Project managementProject management covers planning, milestones, objectives, scope, control, estimating, assumptions and constraints, problem statements, mission statements, identifying strategy, deliverables, work breakdown structure (wbs), plan types, dependencies, PERT, critical path management (cpm), cost terminology, the project manager, report writing, manual methods, resource levelling, popular project management systems, quality function deployment and more...
- Risk managementRisk management covers proactive and reactive planning, triggers, monitoring and control, risk combination,
what is risk, core process steps, project life cycle, terminology, cumulative probability graph, modifying plans,
plan types, identifying risk issues, assessing risk, cost model, Monte Carlo distribution, probability density function (PDF), uncertain events, correlated events, budget versus contingency, simple networks, Markov chain and more... - Time managementTime management covers goals, objectives, time logs, filing, delegation, planning, key time destroyers,
prioritising, urgent versus important, typical process, strategies, positive thinking,
mind maps, monochronic and polychronic time, culture,
convergent and divergent thinking, assertiveness, stress and more... - LeadershipLeadership covers definition, the vision, influencing, change, confidence, motivation,
strategy, personality indicators, trust and integrity, empowerment, prioritising, proactivity,
SWOT analysis, strategy, insight, personal direction, the three C’s, being positive, self discipline,
leadership training, meetings and agendas, styles and more... - MotivationMotivation covers performance management, empowerment, relations and needs, integrity and trust,
consequences, positive and negative reinforcement, measurement, feedback, goals, rewards,
appraisals, creativity and labelling, communication, coaching and mentoring, teamwork and self motivation,
insight, intuition, foresight, inspiration and influence and more...
© Copyright 2025 all rights reserved March Limited