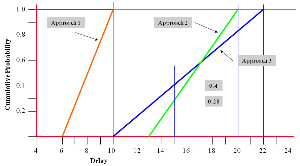
Risk management - Cumulative probability graph
Cumulative probability graph
For simplicity the probability distributions may be better viewed as a straight line [see Cumulative probability graph and The Risk Management process - Evaluate - conditional correlation].
In the examples shown we have 3 approaches being evaluated.
Approach 1
In terms of delay the combination of risks provides the most efficient approach. It is clear of approaches 2 and 3. There is zero likelihood of the delay exceeding 10 weeks.
From this perspective it is the most risk efficient.
Approach 2
This approach must result in at least a delay of 13 weeks and possibly up to 20 weeks.
Approach 3
This approach must result in a delay of at least 10 weeks and possibly 22 weeks with a broader spread of values.
In these scenarios approach 1 is favoured although this may be at the expense of extra costs which need closer scrutiny.
Extra risk efficiency versus extra cost can be a trade off.
If you only had to choose from approach 2 or 3 then 3 would be favoured. Although this has the most extreme values the lower expected value will often make up for the reduced extremes in approach 2.
If we look at the likelihood of approaches 2 and 3 not exceeding a delay of 15 weeks then approach 2 would be 28% and approach 3 would be 40%.
Put another way the likelihood of exceeding 15 weeks would be 72% for approach 2 and only 60% for approach 3.
The exact nature of how the lines ‘cross’ would need to be looked at carefully.
The combination of risks is usually carried out using suitable software which is referred to later in terms of using Monte Carlo simulations which are looked at in more detail later.
Next some basic statistical terms are introduced [see Basic statistical terms].


